Part 2: How to Spot the Sugar in Nutrition Labels
Written By: Irene Castillo, MPH, RDN
Nutrition labels are fun! They hold the key to decoding what you’re about to consume. Check out this nutrition label.
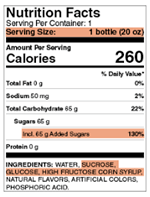
One bottle of this beverage has 65 grams of added sugar. Woah! In a 2,000-calorie diet, no more than 200 calories should come from added sugars (that’s 10%). But what about grams of sugar? Translating calories to grams of sugar is easy, you simply divide by four. So, for 200 calories, dividing by four gives you 50 grams. Do you see the problem here? You’re already over your daily target with just one drink.
Something else about nutrition labels. Did you know the ingredients are listed in order of quantity? A good rule of thumb is to scan the top three ingredients after water since they’re the main ingredients you’re about to drink! In the label here, that means sucrose, glucose, and high fructose corn syrup are coming your way.
What does all this added sugar mean for your routine? Well, if you have a café mocha with breakfast (20 grams of added sugars per serving) and a sweetened tea at lunch (29 grams of sugar per serving), you’re already at 49 grams. Then, when dinner rolls around, you might add a soda to your meal (37 grams per serving), or think you’re making a better choice by going with lemonade (43 grams per serving). Wowzers! Now your daily total is close to 90 grams of added sugars! That’s way more than the 50 grams we calculated earlier and that’s not including any bonus drinks or added sugars in your food. The bottom line – sugary drinks make it very hard to stick to a diet.
Now, what are you supposed to do with all this information? The simple answer, make some more mindful choices when it comes to your beverages. For starters, skip the syrup at the coffee shop. You can also make your own batch of herb-infused water (Try our recipe below!). Who doesn’t love water? And, drinking water may activate your metabolism which positively impacts your energy levels and its calorie-free. Remember that math problem from before? Zero calories mean zero grams of sugar. One last thing, some beverage choices such as milk or 100% juice can also have added nutritional benefits, so introduce them to your routine as a substitute for the drinks with added sugars. Stay well, Sugarbugs, and stay tuned for the third and final segment in this blog series: Sugar in Your Blood!
Sugarbug’s Berry & Mint Infused Water
INGREDIENTS (Gotta Have ‘Em)
- Water (1 pitcher)
- Strawberries (handful, sliced)
- Blueberries (handful, toss ‘em in)
- Mint leaves (grab a bunch)
- Ice (as cold as you like it)
INGREDIENTS (Maybe You Want ‘Em)
- Raspberries (they’re fun)
- Huckleberries (yeah, they’re a thing)
- Boysenberries (if you can find ‘em!)
- Mulberries (isn’t there a song about them?)
- Basil (if you’re feeling adventurous)
Combine and Enjoy!
Sources:
1. Centers for Disease Control and Prevention. (2020). Get the facts: added sugars and consumption. Retrieved from: https://www.cdc.gov/nutrition/data-statistics/added-sugars.html
2. U.S. Department of Agriculture, US Department of Health and Human Services. Dietary Guidelines for Americans, 2020-2025. 9th Edition. December 2020. Available at DietaryGuidelines.gov.
3. American Heart Association. (2019). Understanding ingredients on food labels. Retrieved from: https://www.heart.org/en/healthy-living/healthy-eating/eat-smart/nutrition-basics/understanding-ingredients-on-food-labels
4. U.S. Department of Agriculture, Agricultural Research Service. (2020). USDA Food and Nutrient Database for Dietary Studies and USDA Food Patterns Equivalents Database 2017-2018. Retrieved from: https://www.ars.usda.gov/northeast-area/beltsville-md-bhnrc/beltsville-human-nutrition-research-center/food-surveys-research-group/
5. National Institutes of Health. (2010). NIH study shows how insulin stimulates fat cells to take in glucose. Retrieved from: https://www.nih.gov/news-events/news-releases/nih-study-shows-how-insulin-stimulates-fat-cells-take-glucose
6. National Institute of Diabetes and Digestive and Kidney Diseases. (2018). Insulin resistance and prediabetes. Retrieved from: https://www.niddk.nih.gov/health-information/diabetes/overview/what-is-diabetes/prediabetes-insulin-resistance#insulinresistance
7. Malik, V., Popkin, B., Bray, G., Desprs. J.P., Hu, F. (2010). Sugar-sweetened beverages, obesity, type 2 diabetes mellitus, and cardiovascular disease risk. Circulation.121(11):1356-1364.
8. Malik, V.S., Hu, F.B. (2015). Fructose and cardiometabolic health: what the evidence from sugar-sweetened beverages tells us. J Am Coll Cardiol. 66(14):1615-1624.
9. Bomback, A., Derebail, V., Shoham, D., et al. (2010) Sugar-sweetened soda consumption, hyperuricemia, and kidney disease. Kidney International. 77(7):609-616.
10. Bernabe, E., Vehkalahti, M.M., Sheiham, A., Aromaa, A., Suominen, A.L. (2014) Sugar-sweetened beverages and dental caries in adults: a 4-year prospective study. J Dent. 42(8):952-958.